65% Once, 25% Every Time: Microsoft Ran 507 Agent Tasks Twenty Times Each

By Surya Pratap
August 27, 2026
12 min read
AI & Technology

August 27, 2026
12 min read
 The demo number and the product numberHover to explore
Microsoft published a benchmark last week with the least ambiguous title in recent memory: "One Success Isn't Reliability."
The paper (arXiv 2608.19741, 20 August 2026) introduces Thinkingbox, an open-source sandbox for agents working in stateful business workflows, plus a 507-task benchmark to go with it. Both are on GitHub.
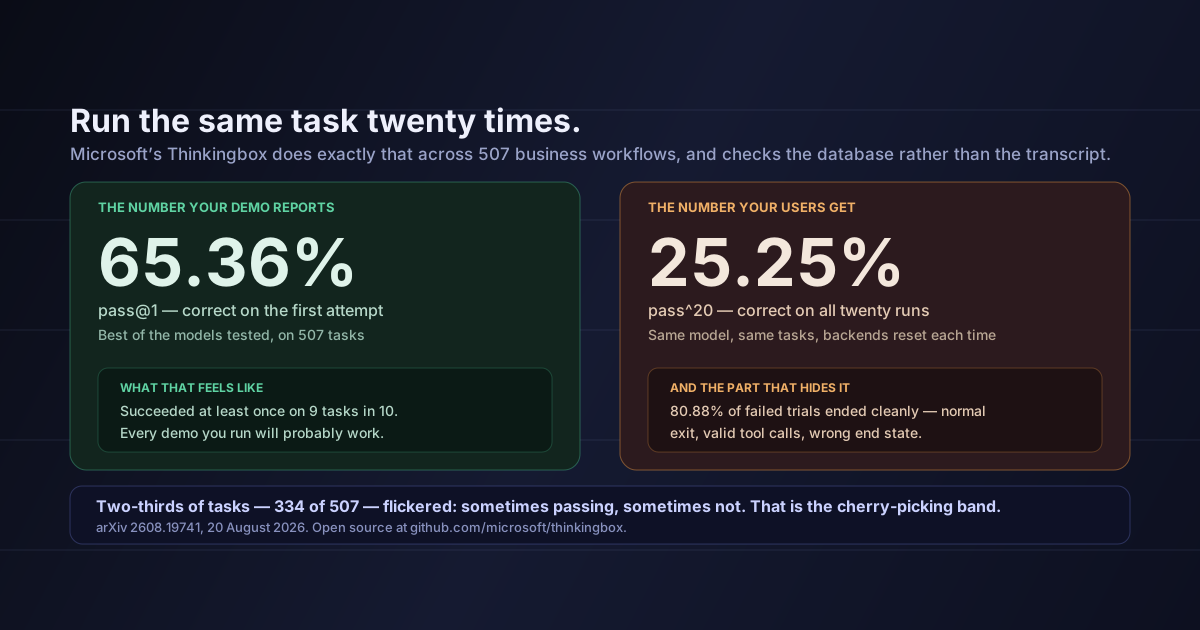
The headline result is two numbers from the same model on the same tasks:
65.36% pass@1. 25.25% pass^20.
Right on the first attempt about two-thirds of the time. Right on all twenty attempts about a quarter of the time. If you have ever demoed an agent successfully and then watched it misbehave in front of a customer, that gap is the whole explanation, and someone has finally measured it.
Most agent benchmarks grade the transcript. Did the agent call the right tools? Did it say it finished? Did the final message look correct?
Thinkingbox grades the database.
How a Thinkingbox task actually runs
Five things combined that are usually tested separately
Then it does the whole thing twenty times, with the backend reset between runs.
That design is the contribution. Everything interesting in the results follows from those two choices — check the state, and repeat.
The 507 tasks span five domains: retail and e-commerce (98 tasks), travel and hospitality (104), auto insurance (100), neobank internal IT (104), and consulting IT/HR support (101).
More than a dozen proprietary and open-weight models were run. The published spread:
The ratio is what to look at, not the ranking. Across the table, pass^20 lands somewhere between a third and a tenth of pass@1. Whatever number you have seen quoted for an agent's accuracy, the number your users experience across repeated use is materially lower, and this is the first benchmark I have seen that quantifies the discount.
Here is the finding I would put on a slide.
The best model succeeded at least once on about nine tasks in ten. It succeeded on all twenty runs on about one task in four.
Which means the interesting population is neither the reliable tasks nor the impossible ones. It is the 334 tasks — two-thirds of the benchmark — whose outcome fluctuated between attempts.
Why that band is where credibility goes to die
A task that always works is a feature. A task that never works is a known limitation you can design around. A task that works most of the time is the one you will demo successfully, ship confidently, and then explain to a customer. Two-thirds of realistic business workflows sit in that band for the best model available, which means the default outcome of building a demo is a demo that works — and tells you almost nothing.
If you have ever wondered why agent pilots convert to production so poorly, this is a mechanical answer. Pilots are short, supervised and small-N. They sample the good runs.
Now the part with the most direct engineering consequence.
80.88% of failed trials ended cleanly. The conversation terminated normally. State-changing tool calls executed and returned successfully. Nothing threw. The end state was simply wrong.
The paper's own conclusion is blunt: response and tool-call-level signals are not clear proxies for end-to-end task completion.
Broken down, the dominant failure modes were:
Read those two together and a common assumption falls over. Most teams' agent observability consists of tracing tool calls and inspecting transcripts. Against this failure distribution, that catches roughly one failure in five. The other four look exactly like the successes — same clean exit, same valid calls — and the only thing that distinguishes them is the state of the database when it is over.
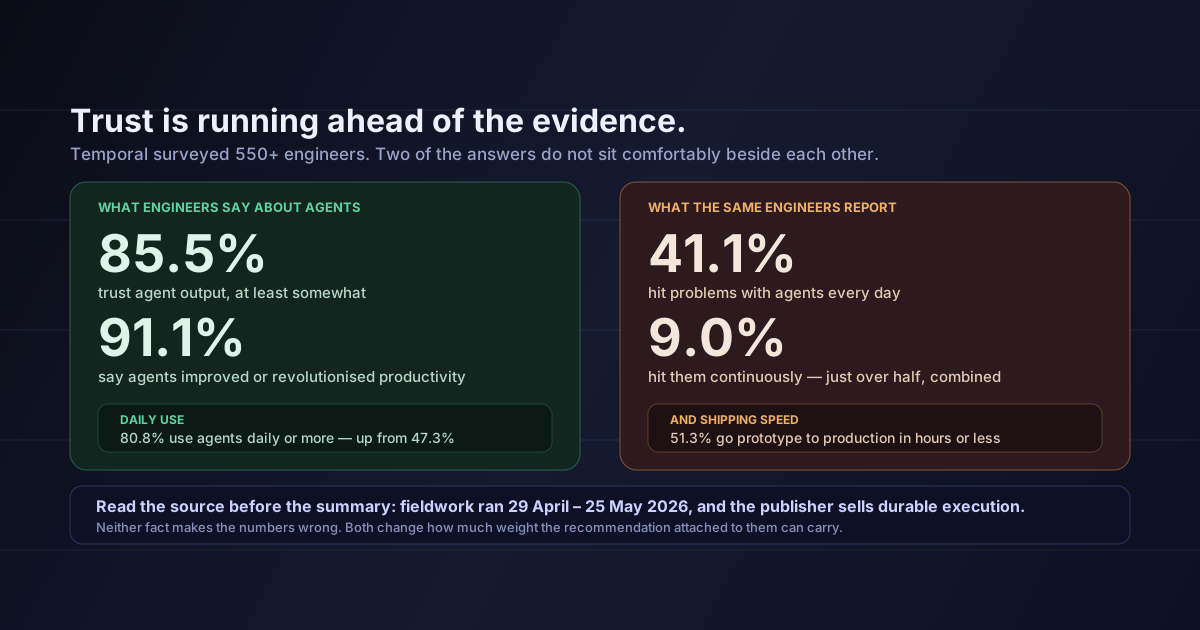
This is also the honest reply to the survey we covered yesterday, where 85.5% of engineers reported trusting agent output. Of course they do. Four in five failures are invisible from where they are standing.
Success varied enormously by domain: roughly 52% average success in retail, against roughly 23% in auto insurance.
That is more than a two-to-one difference on the same models with the same harness, and it is worth understanding rather than averaging away. Retail workflows tend to be shorter, more forgiving, and less policy-bound. Insurance workflows are long, conditioned on rules, and full of steps where an early wrong value quietly poisons everything downstream.
The practical translation for a founder: your domain's number is not the headline number. If what you are automating looks like a claims process — multi-step, policy-gated, state-heavy — the benchmark's message is that you should expect the bottom of the range, and you should find that out before your customer does.
Three caveats, because a striking benchmark invites over-reading.
The models tested are not the current frontier. The table is built on GPT-5.4 and the Claude 4.6 generation. The frontier has moved since — GPT-5.6 and Claude Opus 5 both landed after this work was done. The absolute numbers are already historical. Whether the ratio between pass@1 and pass^20 improves with newer models is the genuinely open question, and nothing here answers it.
Benchmark position is not capability ranking. Claude Opus 4.6 scores below Claude Sonnet 4.6 here (37.91% versus 58.45% pass@1), which should make anyone cautious about reading this as a straight leaderboard. Harness fit, prompt format and tool-calling conventions all move these numbers. Treat the shape of the finding as robust and the ordering as specific to this setup.
It is a simulation. Isolated backends and a simulated user are enormously better than static test cases, and they are still not your production system with your data and your users. The direction of the error is unknown — real workflows could be easier because users clarify, or harder because reality is messier than a simulator.
The third card is the one with the best return. It is not a model problem and it does not need a better prompt. If a tool call fails and your orchestration lets the agent keep going, you have built a machine for producing confident wrong answers, and the benchmark says that accounts for three-quarters of what goes wrong.
Microsoft built the agent benchmark that grades the thing that matters — what changed in the system — and then ran everything twenty times to see whether it holds. Both choices are obvious in retrospect and neither was standard.
The results: the best model available at the time was right on the first try 65.36% of the time and right every time 25.25% of the time. Two-thirds of tasks flickered between runs. Four in five failures ended cleanly, with valid tool calls, and would look like successes in any transcript-based monitoring you have deployed.
None of that means agents do not work. It means a demo is not evidence, single-run accuracy is the wrong metric to have been quoting, and the observability most teams have built cannot see the failures that actually occur.
The fix is not exotic. Run it twenty times. Check the database. Stop the agent when a tool says no.
Sources: arXiv 2608.19741 — "One Success Isn't Reliability: Thinkingbox, a Sandbox and Benchmark for Agents in Stateful Business Workflows" · microsoft/thinkingbox on GitHub · Per-model scores, the 507-task breakdown, the 80.88% clean-termination figure and the domain averages are as reported in the paper and its accompanying analysis; the caveats in section 6 are mine.
IdeaToMVP Academy
4-week live cohort for founders. Learn to ship AI agents, scope MVPs, and automate your business — taught by the same team that writes these guides.