
85.5% of Engineers Trust Their Agents. Half of Them Hit Problems Every Day

By Surya Pratap
August 26, 2026
11 min read
AI & Technology

August 26, 2026
11 min read
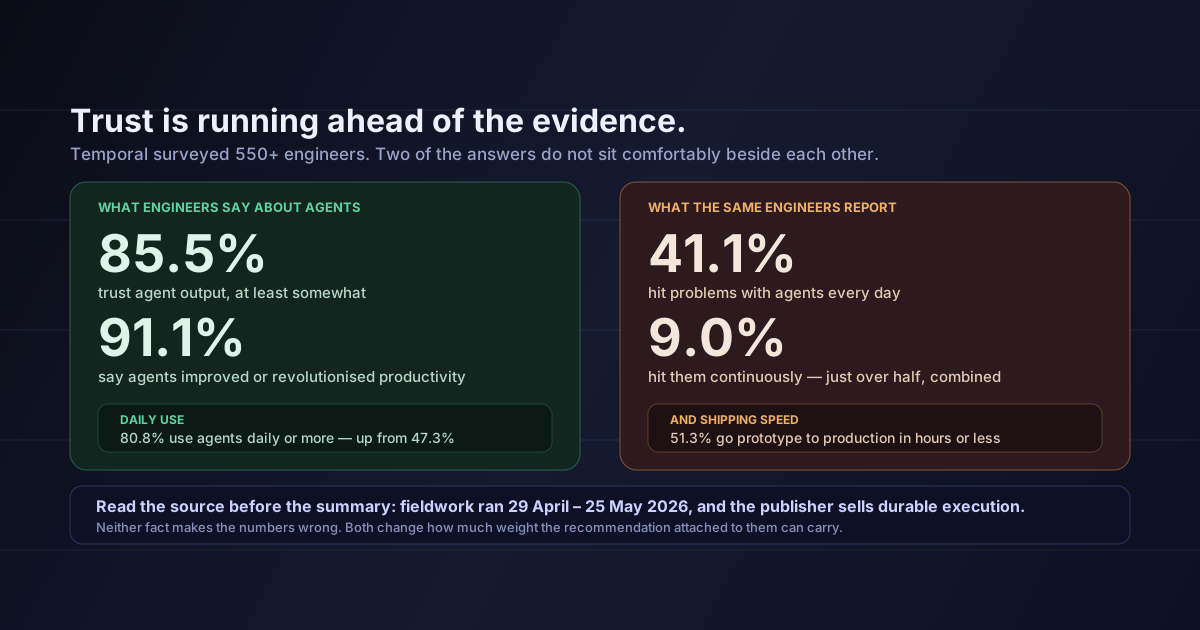 The same people, two answersHover to explore
Temporal published its 2026 State of Development Report: AI Agents this week, and the number doing the rounds is the adoption one: 80.8% of engineers now use agents daily or more often, up from 47.3% a year earlier — a 70.8% relative jump.
That number is real and it is not very interesting. Adoption curves go up; this one went up steeply. If you were waiting for confirmation that agents have gone mainstream in engineering, here it is, and you can stop waiting.
The interesting numbers are two pages further in, and they do not sit comfortably beside each other.
Before the findings, the shape of the thing, because it decides how much weight any of it can carry.
Methodology, as published
Temporal, 2026 State of Development Report: AI Agents
That is a respectable sample for a practitioner survey and a narrow one for a claim about "engineers." It skews mid-size and Anglophone, and it is self-selected: people who answer a survey about AI agents are people with opinions about AI agents.
Here is the pair.
85.5% of respondents say they trust agent output, at least somewhat. 91.1% say agents have improved or revolutionised their productivity.
And: 41.1% encounter problems with agents daily. A further 9.0% encounter them continuously.
Just over half the sample is hitting problems every single day, and roughly six in seven trust the output anyway.
Both figures came from the same people in the same instrument. Neither is a lie. But held together they describe something specific, and it is not "agents work well."
They describe a calibration gap: confidence that has moved faster than the evidence supporting it. That is a normal and well-documented thing for humans to do with tools that are impressive most of the time and wrong unpredictably — and it is precisely the condition under which people stop checking.
Why 'at least somewhat' is doing a lot of work
The trust figure is a soft one — the question allows anything above indifference to count. That is a legitimate way to ask it, and it means 85.5% should be read as "most engineers are not hostile to agent output," not as "most engineers would ship it unreviewed." The failure figure, by contrast, is a hard behavioural count of how often something went wrong. Comparing a soft measure to a hard one is exactly why the two can both be true; it is also why the softer one deserves less weight than the headline gives it.
One more number worth stopping on: respondents run a median of 5 agents and a mean of 10.7.
When the mean is more than double the median, the distribution has a long right tail. A minority is running a great many agents and pulling the average up, while the typical engineer runs a handful.
That matters for how you read everything else in the report, because those two populations are not having the same experience. The person running thirty agents has industrialised something. The person running five is using agents the way one uses an IDE feature. Aggregate satisfaction figures average across both, and the resulting number describes nobody.
If you are trying to work out whether your team is behind, the median is the relevant statistic and it is five.
51.3% of respondents say they get from prototype to production in hours or faster. 26.9% say minutes or faster.
Put that against 41.1% hitting problems daily and the shape of the risk becomes clear. The constraint that used to sit between "this works on my machine" and "this is live" was time — time in which someone read the diff, ran the suite, thought about the edge case. Agents compressed that window to minutes for a quarter of respondents.
Compression is only a problem if verification did not compress with it. Mostly it did not: writing code got dramatically cheaper, and confirming that code is correct got a little cheaper. The gap between those two rates is where the daily problems live.
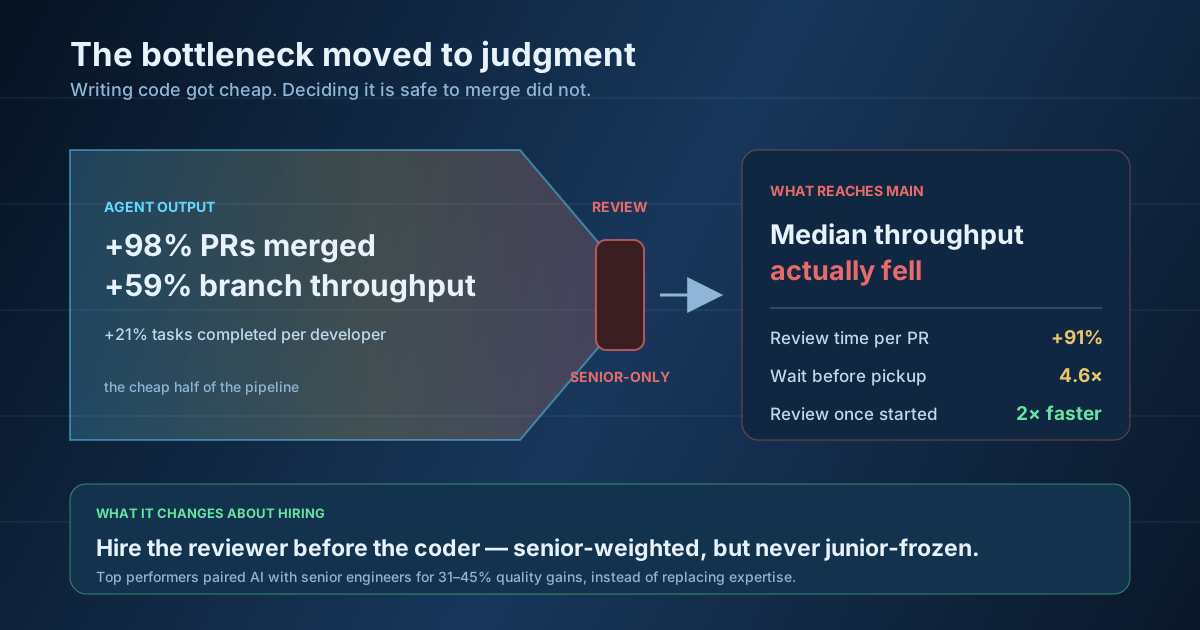
This is the same mechanism we wrote about in the review bottleneck: generation scaled, review did not, and the queue moved rather than disappeared. This survey is the first large-sample evidence I have seen that the pattern is now the median experience rather than an early-adopter complaint.
Buried in the career-sentiment section is the finding with the most direct commercial consequence for anyone reading this:
92.3% of respondents have attempted to recreate software they already pay for.
Attempted. Not succeeded — the survey measures the attempt, and that distinction is the whole story. But nine in ten engineers now reaching for "we could just build this" changes the default posture in every procurement conversation your sales team will have next year.
For a founder shipping an MVP, the practical read is not "SaaS is dead." It is that the burden of proof moved. You now have to be explicit about why buying beats building, because your buyer has already tried building — and the honest answer is almost never the feature list.
I want to be direct about the source, because it changes what the report's conclusion is worth.
Temporal sells durable execution — infrastructure for long-running, stateful, retryable workflows. The CEO's framing of the findings is:
The teams pulling ahead are those who trust their systems more, because they've solved for state, cost, and reliability.
State and reliability are the two things Temporal's product exists to provide. That does not make the sentence wrong; it does mean the report's recommendation and the publisher's revenue point in the same direction, and you should discount accordingly. The raw percentages are much more trustworthy than the interpretation laid over them, which is generally true of vendor research.
The second caveat is age. Fieldwork closed 25 May 2026; publication is late August. In most industries a three-month-old survey is current. In this one, three months covers several frontier model releases and at least one shift in how coding agents are used. The adoption number is almost certainly an undercount by now. The reliability numbers could have moved either way, and nobody — including Temporal — knows which.
The one thing I would not do is treat 80.8% as a mandate. Adoption statistics are the most quoted and least actionable numbers in any survey — they tell you what is normal, and normal is not the same as correct. Half of that 80.8% is hitting problems daily.
The headline finding is that agent use among engineers roughly doubled in a year and is now near-universal on a daily basis. Take that as settled.
The finding underneath it is more useful and less comfortable: trust has outrun reliability. 85.5% trust the output while just over half hit problems daily or continuously, and half the sample ships to production in an hour or less. That is not a story about agents being bad. It is a story about a verification layer that did not scale at the same rate as the generation layer, in an environment where nobody has time to notice.
And the number to take to your next board meeting is the one nobody is quoting: 92.3% of engineers have already tried to rebuild something they pay for. They mostly failed. They will try again with better tools, and your answer for why they should not needs to be better than a feature comparison.
Count your own failure rate before you trust anyone else's.
Sources: Temporal Technologies, "Temporal Releases The 2026 State of Development Report: AI Agents" · Temporal Technologies · All percentages, the 550+ sample size and the 29 April – 25 May 2026 fieldwork dates are as reported by Temporal; the interpretation and the caveats are mine.
IdeaToMVP Academy
4-week live cohort for founders. Learn to ship AI agents, scope MVPs, and automate your business — taught by the same team that writes these guides.